The Endurance22 Expedition utilised the expertise of sea ice researchers from the Alfred Wegener Institute (AWI), the German Aerospace Center (DLR) and Drift+Noise Polar Services (an AWI spin-off company) with more than 15 years of operational experience in polar regions. The researchers assisted the Expedition in providing ice navigation support as well as undertaking a programme of sea ice monitoring and measurements.
To support the research, as well as to assist in locating ice floes that can support the sea-ice camps (if required), ice and surface snow thickness measurements were undertaken using non-invasive remote sensing methods from satellites, as well as geophysical measurements from the Agulhas II vessel and from towed sledges on the ice.
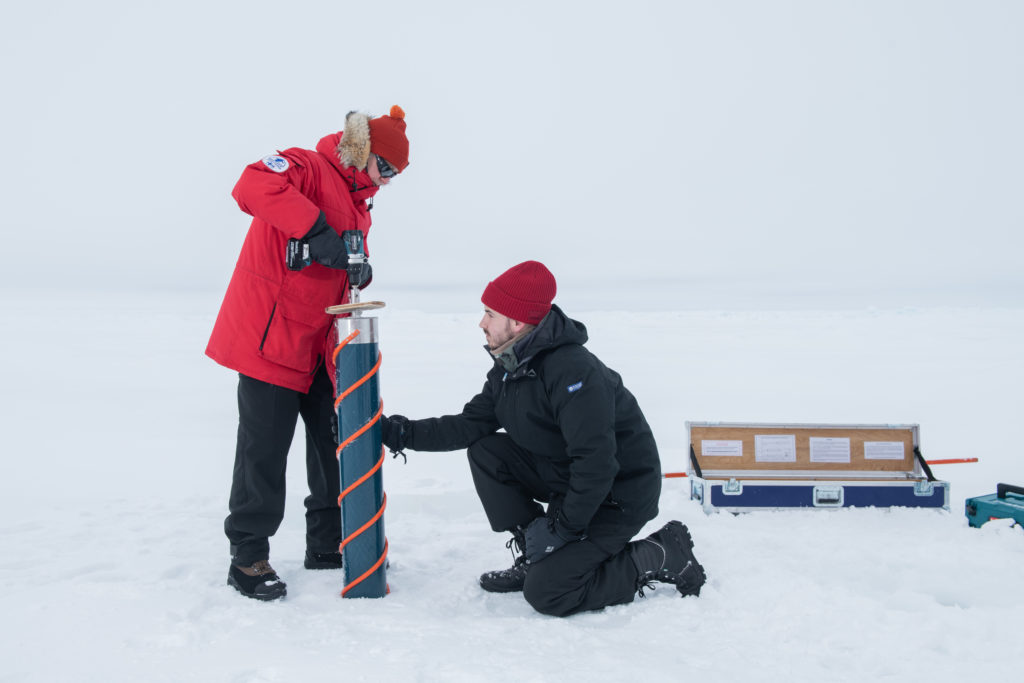
To study and enhance the knowledge on snow and ice properties, sea-ice cores (1 to 5 metres long and 10cm wide) were taken from selected ice floes using electric-powered ice-coring devices as well as snow samples.
The research team of the AWI also deployed up to four ‘snow buoys’ to selected ice floes. The snow buoys are designed to measure the small-scale variability of snow thickness. For this purpose, each buoy is equipped with ultrasonic sensors that measure the distance to the surface. By calibrating it using the snow depth measured during deployment on the ice, it is possible to continuously calculate the change in snow depth. In addition, the air and surface temperature, as well as the air pressure is recorded.
Average Sea Ice Concentration of February 15 (2017-2021)
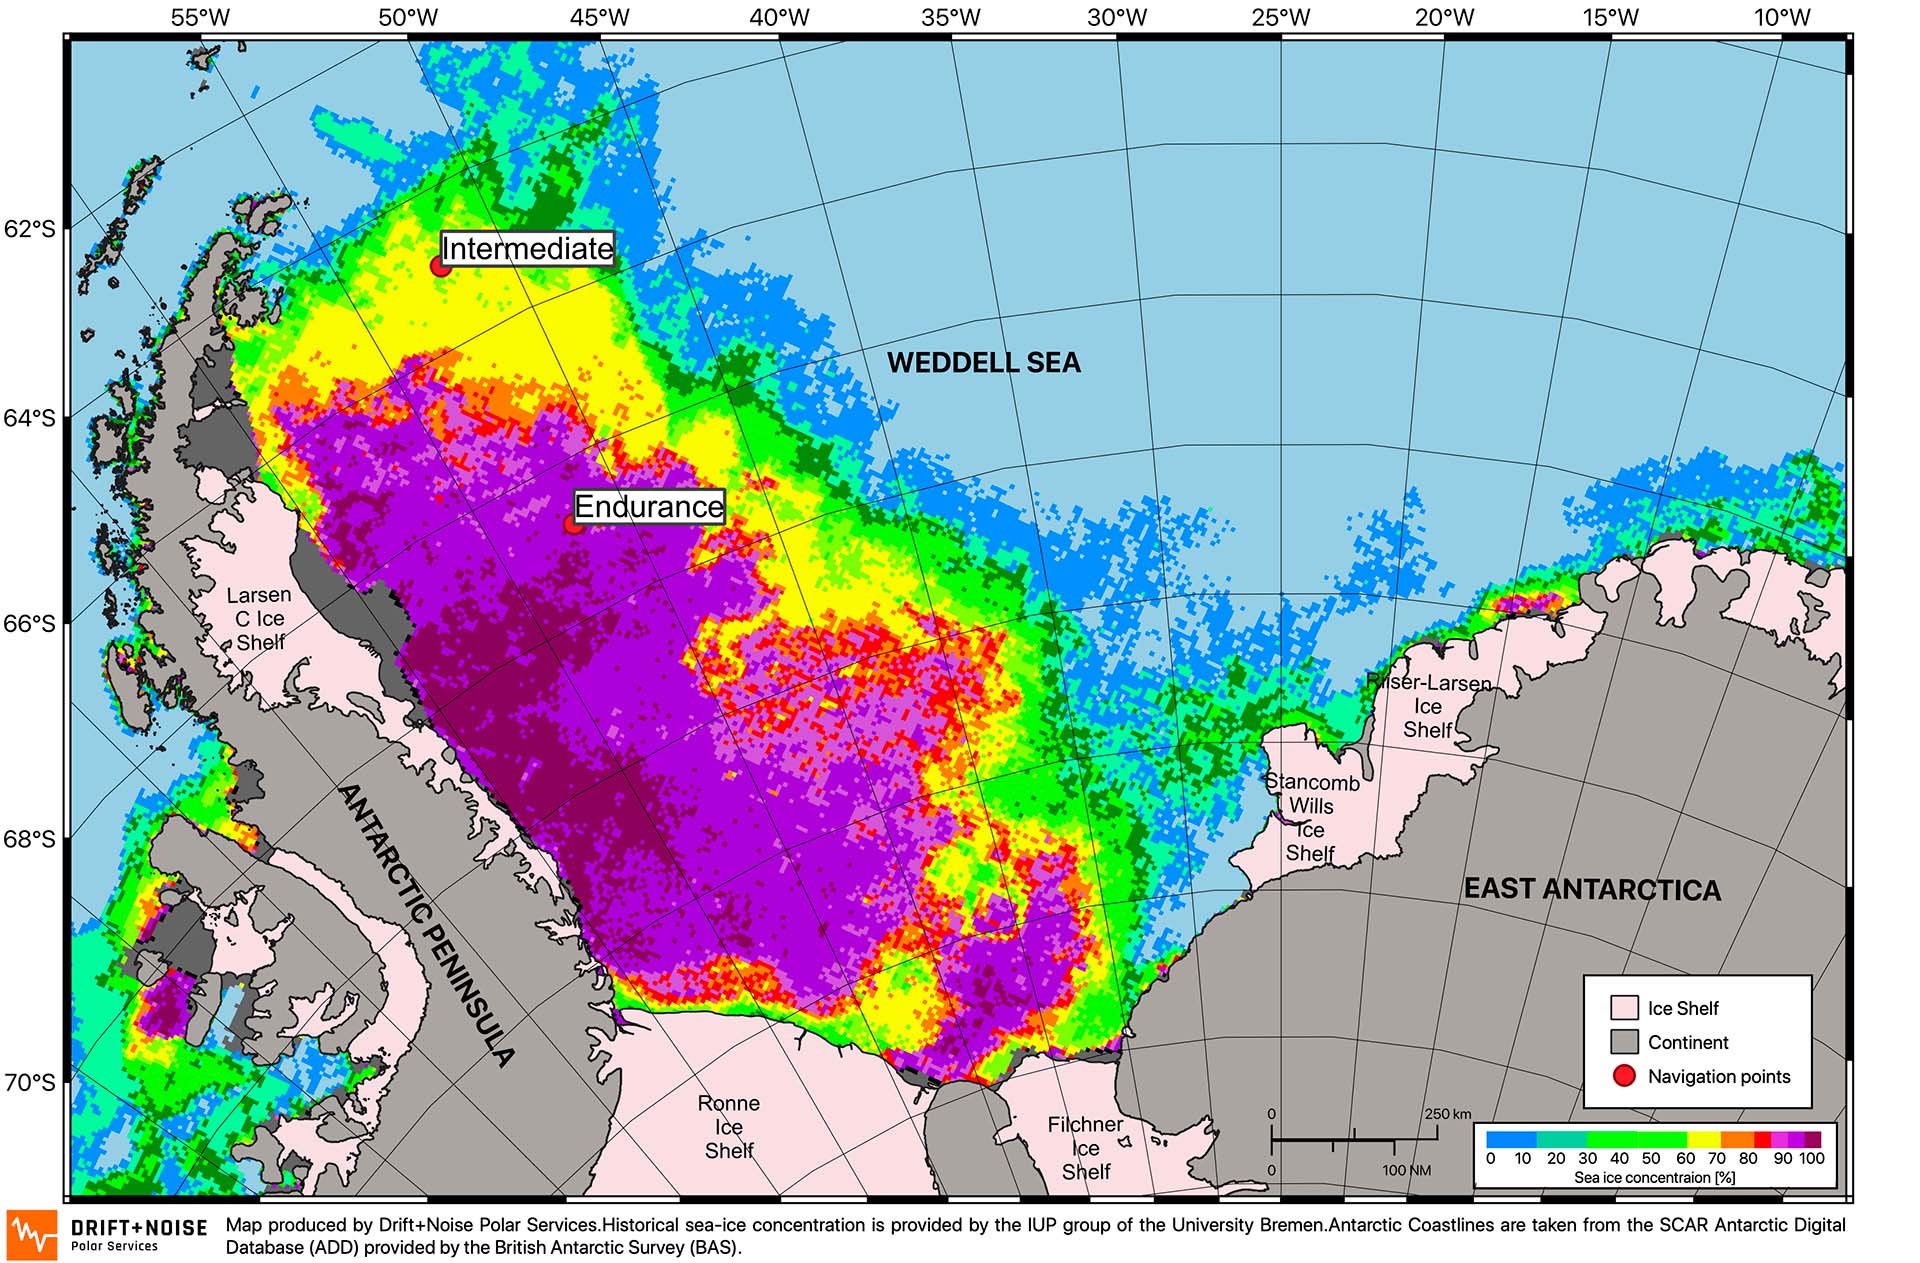
The image above shows the average sea-ice concentration on February 15 of the last 5 years. The colors refer to the percentage of the ocean covered with sea-ice and icebergs.
Historical sea-ice concentration is provided by the IUP group of the University Bremen.
Antarctic Coastlines are taken from the SCAR Antarctic Digital Database (ADD) provided by the British Antarctic Survey (BAS).
Sea Ice Concentration on 21 January 2022
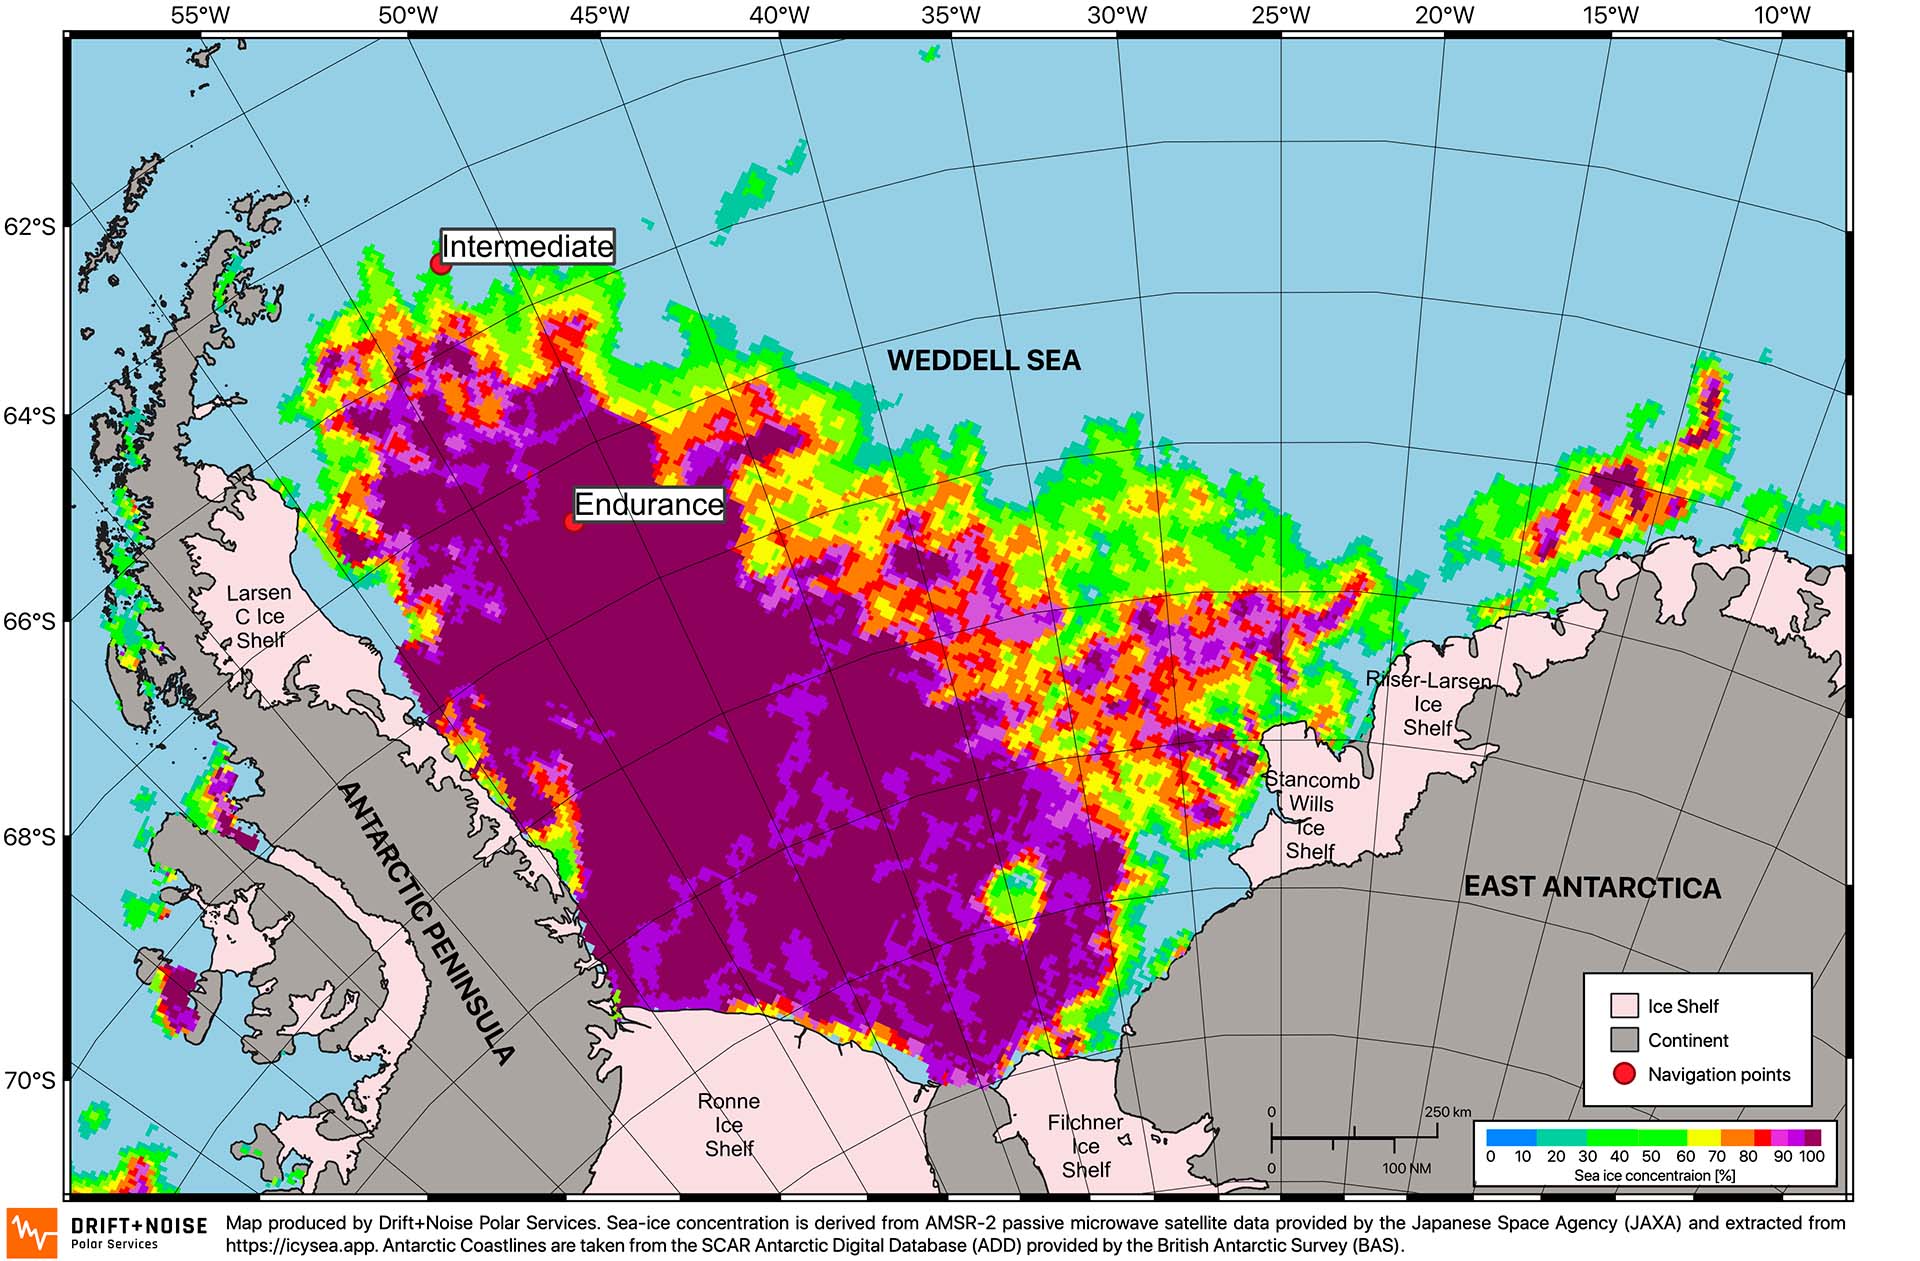
The image above shows the latest sea-ice concentration in the Weddell Sea. The colors refer to the percentage of the ocean covered with sea-ice and icebergs (see color legend).
Sea-ice concentration is derived from AMSR-2 passive microwave satellite data provided by the Japanese Space Agency (JAXA) and extracted from https://icysea.app
Antarctic Coastlines are taken from the SCAR Antarctic Digital Database (ADD) provided by the British Antarctic Survey (BAS).
Sea Ice Facts
-
The worldwide sea ice cover is a driver of the global climate but also an indicator for a changing global climate. The worldwide sea ice cover acts as a large mirror for the sun, reflecting its energy back and thus preventing additional heating of the ocean. However, when the sea ice melts, the mirror effect vanishes and the ocean heats up even more. This is called the ice-albedo feedback.
-
The formation of sea ice has an important role in the formation of the global ocean conveyor belt.
-
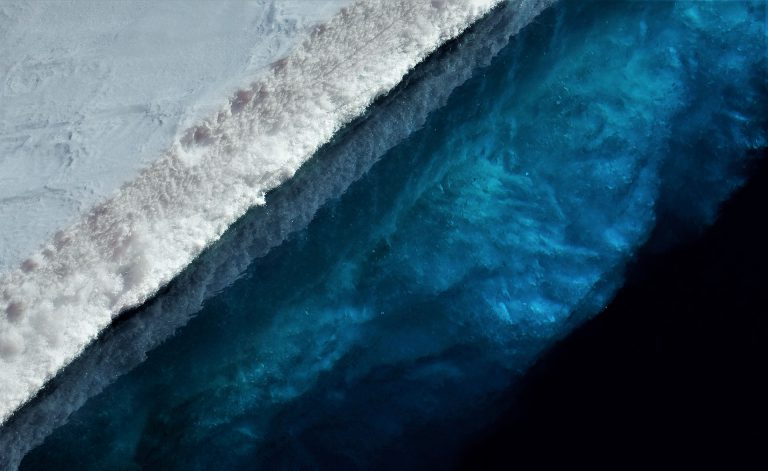
Sea ice is a very heterogeneous medium. It originates with cold air temperatures but grows and changes with dynamic forces from the wind. A majority of the sea ice is heavily deformed ice ridges and rubble fields. Shackleton’s Endurance was crushed by those dynamic forces.
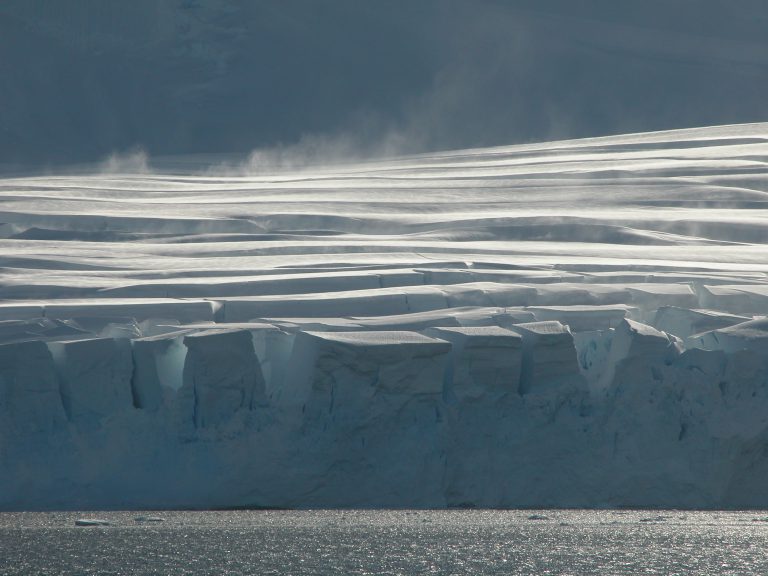
Weddell Sea Ice
The sea ice in the Weddell Sea is different to most of the sea ice in other parts of the world. In contrast to the Arctic sea ice, the Antarctic sea ice cover is not yet declining. The Weddell Sea ice is the only region where you have a significant area of multi-year ice in Antarctica.
Sea Ice & Snow Property Measurements (AWI)
The only way to continuously monitor the volume of sea ice in Antarctica is with satellite measurements from space. Such measurements have a large uncertainty as the sea-ice layer is a very complex structure and too little is known about it. Especially little is known in the Weddell Sea.
To improve the monitoring capabilities of our world’s sea-ice layer, we need to understand the internal ice structure better. Weddell sea-ice has a very complex internal structure, consisting of sea ice, snow, refrozen snow, superimposed ice (ice which was flooded). During the Endurance22 expedition, the AWI (Alfred Wegener Institute for Polar and Marine Research) team collected snow and ice samples and analysed the internal structure of ice floes.
Operational support by sea-ice research (DNPS, DLR, AWI, SAWS)
Endurance22 is a super exciting showcase for today’s operational capabilities to navigate and work effectively in sea-ice. A lot of the scientific researchers on board will take this opportunity to test their methods in an operational context. 6 different sea-ice drift models contributed daily to support the search for the Endurance wreck. Thus the Endurance22 expedition was supported by upfront research of the weather, ocean and ice modelling community.
It was a challenge to predict 3 days in advance, the drift of an ice floe accurately enough so that the ice floe will end up over the Wreck site. Endurance22 was a litmus test for today’s operational sea-ice information systems.
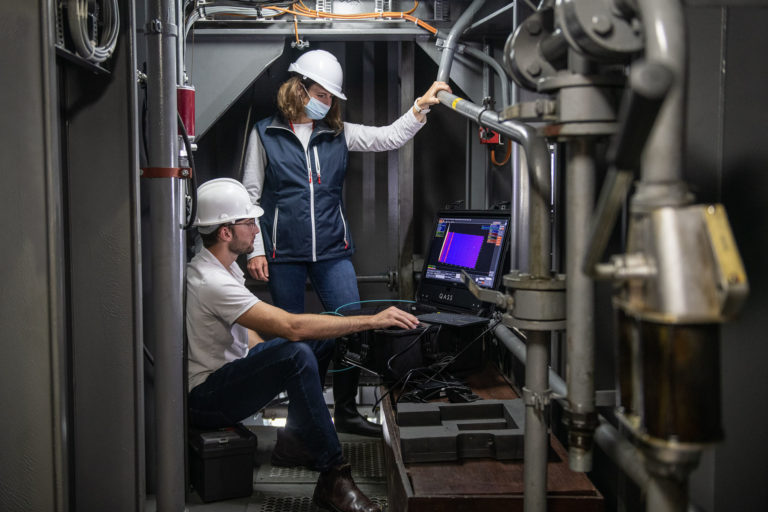
To find the best ice floe for the ice camp, scientists from AWI on board used an electromagnetic device to survey the thickness of the ice floe. Such devices are normally used at the AWI from aircraft and helicopters to measure ice thickness along longer transects every year, to study the change of sea-ice thickness in the Arctic.
The science team also used a brand-new ice information App called ‘IcySea’, which is suited for the low-bandwidth internet connection on-board ships, especially in the Polar Regions. The IcySea technology was tested to see how well it increases the navigational capabilities of an ice breaker ship. If Shackleton had IcySea technology on board, he might have found a better path to the inland ice where he wanted to land for his trip to the South Pole.
In support of the wreck search and for the ship’s navigation, scientists received and analysed high-resolution radar images by the TerraSAR-X satellite (DLR) and by ESAs Sentinel satellite series.
Improving ice information of the future (DLR, KuP, DNPS, SAWS)
Today, the creation of sea-ice charts is still a very cumbersome and time-consuming job. In Antarctica especially, not much ice information to support shipping exists, as there is no dedicated national ice service responsible (the Norwegian and Unites States Ice Services provide weekly ice charts). However, with today’s advent of earth observation, producing terabytes of satellite data every day, there is the potential to create ice charts automatically in near-real-time. The goal is to eventually have a live Google Earth representation of the constantly changing sea-ice covers of the world. The ultimate sea ice information service would image the different types of ice continuously and automatically.
Scientists from the Eis-Klass 2 project (DNPS, DLR, KuP) joined the cruise. They are developing artificial intelligence to do the work of an ice analyst automatically and in a fraction of the time. The results of such created ice charts are not yet sufficient. To improve them we need more validation data – During Endurance22 several camera systems measured and recorded the ice situation along the cruise track, complemented by manual ice observations from the bridge of Agulhas II.
Ice navigation of the future
A unique dataset will be available after the expedition which will combine ice & snow properties, ship performance with optical and radar satellite measurements. Digitisation is an important topic for the Stellenbosch researchers and for the team of DNPS. The ultimate goal of those researchers and engineers is to create a Google map representation for shipping in polar waters.
The digitised ship of the future will be connected to a big-data cloud. “Big-data” such as satellite images, weather data, data from the ship, model forecast data etc…. will be analysed constantly in the future to provide ships with information important for safety and performance.